GraphXY
GraphXY is a tool created for a specific need but written to be more generally useful.
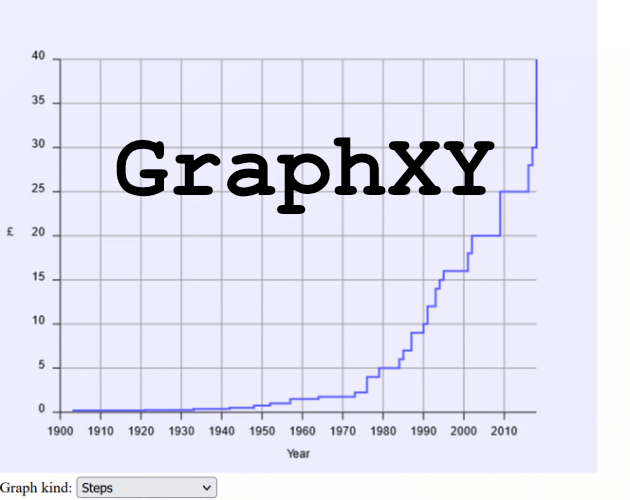
The need was on a web page about the history of a club. There is a list of annual subscription amounts against years. Alongside the list is a graph that was created in a spreadsheet and saved as an image. The trouble is that as the years go by and the subscription amount changes it becomes tedious to keep recreating the image and replacing it on the web page. The image should be generated automatically from the data in the page.
The JavaScript file graphXY.js does the job. The accompanying file index.html shows how it can work with an example HTML page.
The data in the page were list items, <li>, in an unordered list, <ul>. The HTML was changed so that the <ul> element gained an id attribute and all the <li>s got data-xy attributes. According to the HTML5 specification we are allowed to add attributes to any element as long as their names begin with "data-". That way we avoid clashing with any future changes to HTML.
The JavaScript includes a function for scraping the data from the <ul> and any of its immediate children, <li>s, that have data-xy attributes. The function would work just as well if the parent element was a <table> and the data-xy attributes were on <tr> elements.
Four kinds of graph display are included and the example HTML allows switching between them to see how they look.
The program is written in plainest old-style JavaScript which should run anywhere.
The code is made freely available for anyone to use and adapt to their needs.
Download
Leave a comment
Log in with itch.io to leave a comment.